Customer Retention Analysis
Analytical report, visualising customer retention over time.

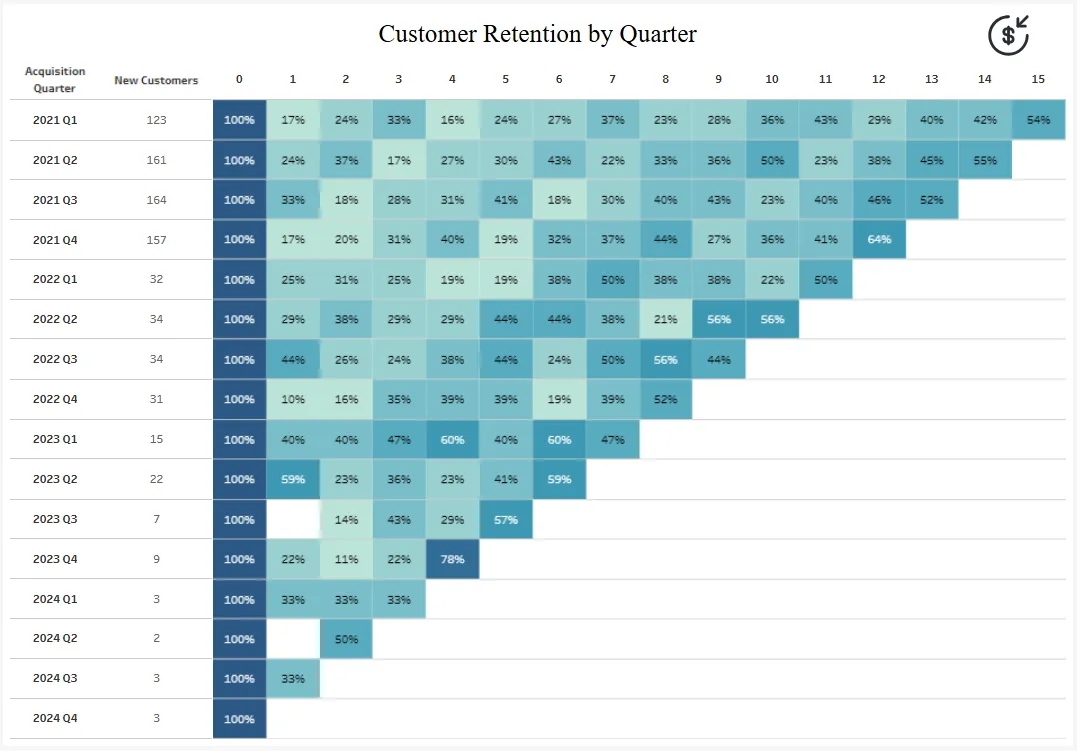
Dashboard Preview
Business Value
What is Cohort Analysis?
Cohort analysis groups customers by their acquisition date (cohort) and tracks their behavior over time. This retention matrix shows what percentage of each customer cohort continues to make purchases in subsequent periods.
Why Cohort Analysis Matters
Without cohort analysis, you might see:
- Total customer count growing → Assume business is healthy
- Average retention rate → Doesn’t show if newer or older customers are more loyal
With cohort analysis, you can:
- Identify if retention is improving - Are recent cohorts more loyal than older ones?
- Measure product-market fit - High early retention suggests strong value proposition
- Calculate customer lifetime value (CLV) - Predict long-term revenue from each customer
- Validate business changes - Did that new feature launched in Q2 2022 improve retention?
- Detect warning signs early - Declining retention in recent cohorts signals problems
Critical Business Questions Answered
-
“Are we getting better at keeping customers?”
Compare retention curves between early cohorts (2021) and recent cohorts (2023-2024) -
“What’s our expected customer lifetime?”
Track when retention rates flatten out (customer maturity) -
“Which acquisition periods brought the most loyal customers?”
Identify best-performing cohorts and replicate those conditions -
“When do most customers churn?”
Spot drop-off periods and implement intervention strategies -
“What’s the ROI of our customer success program?”
Compare retention before/after program implementation
Key Features
- Quarterly Cohort Grouping: Customers grouped by acquisition quarter
- 15-Quarter Tracking: Follow retention up to 15 quarters post-acquisition
- Color-Coded Heat Map: Darker blue = higher retention, lighter = lower retention
- Triangular Pattern: Recent cohorts show fewer periods (haven’t existed long enough)
- New Customer Count: Shows cohort size for context
- 100% Baseline: Quarter 0 always shows 100% (all customers start here)
- Percentage Display: Clear retention rate labels in each cell
How to Read This Dashboard
Understanding the Table
Rows (Acquisition Quarter): When customers first made a purchase
Columns (Quarter Number): Time since acquisition
Values: % of original cohort still active
Example Interpretation
2021 Q1 Cohort:
- Started with 123 customers (100%)
- Quarter 1: 17% still active (21 customers)
- Quarter 2: 24% still active (30 customers)
- Quarter 15: 54% still active (66 customers)
Key Insight: This cohort shows increasing retention over time, possibly indicating customers who stay past the first year become very loyal.
What Good Looks Like
- Strong retention curve: Gradual decline that flattens out
- Improving cohorts: Recent cohorts retain better than old ones
- High long-term retention: 30%+ still active after 8+ quarters
- Small initial drop: < 50% churn in first 2-3 quarters
Warning Signs
- Steep drop-off: Losing 50%+ in first quarter
- Declining trend: Newer cohorts perform worse
- No plateau: Continuous decline without flattening
- Inconsistent patterns: Widely varying retention across similar periods
How to Build This in Tableau
Prerequisites
- Tableau Desktop or Tableau Public
- Dataset with:
- Customer ID (unique identifier)
- Order Date (transaction date)
- Order ID (to count transactions)
Sample Data Structure:
Customer ID | Order Date  | Order ID
------------|-------------|----------
CUST001     | 2021-01-15  | ORD-001
CUST001     | 2021-04-20  | ORD-002
CUST002 | 2021-02-10 | ORD-003Note: This dashboard uses Tableau’s built-in “Sample - EU Superstore” dataset. You can use any dataset with customer purchase history.
📖 Step-by-Step Build Guide
Prerequisites
-
Tableau Desktop or Tableau Public
-
Dataset with: Customer Name, Order Date fields
-
Sample data structure:
Customer Name | Order Date
--------------|------------
John Smith    | 2021-01-15
John Smith    | 2021-04-20
Jane Doe      | 2021-02-10
Data Preparation
Before starting, ensure your data has:
- A Customer Name field (unique customer identifier)
- An Order Date field (transaction date)
- Ideally multiple years of purchase data
Step 1: Determine Acquisition Quarter
This calculation identifies when each customer first made a purchase and groups them by quarter:
Acquisition Quarter
DATE({FIXED [Customer Name]: MIN(DATETRUNC('quarter', [Order Date]))})What this does:
{FIXED [Customer Name]: MIN(...)}- For each customer, finds their very first order dateDATETRUNC('quarter', [Order Date])- Truncates to the start of the quarterDATE(...)- Wraps in DATE() function for proper date formatting- This creates the cohort grouping
Important: This will be placed on Rows as a discrete (blue) exact date dimension
Example: If a customer’s first order was March 15, 2021, this returns 2021-01-01 (Q1 2021)
Step 2: Calculate Quarters Since First Order
Determine how many quarters have passed since each customer’s first purchase:
Quarters Since First Order
DATEDIFF('quarter', [Acquisition Quarter], DATETRUNC('quarter', [Order Date]))What this does:
- Takes the difference in quarters between acquisition and current order
DATETRUNC('quarter', [Order Date])- Truncates current order to quarter start- Returns 0 for orders in acquisition quarter, 1 for next quarter, etc.
Important: This will be placed on Columns as a discrete (blue) dimension
Example:
- Customer acquired in Q1 2021 (Jan-Mar)
- Order placed in Q1 2021 → Returns 0
- Order placed in Q2 2021 → Returns 1
- Order placed in Q3 2021 → Returns 2
Step 3: Count New Customers per Cohort
Create a calculation that counts unique customers acquired in each quarter:
New Customers
{FIXED [Acquisition Quarter]: COUNTD([Customer Name])}Purpose:
- Shows cohort size for context
- Larger cohorts may have different retention patterns
- Used as denominator in retention rate calculation
Important: This will be placed on Rows after Acquisition Quarter as a discrete dimension
Example: If 123 customers made their first purchase in Q1 2021, this returns 123
Step 4: Calculate Retention Rate
The key metric - what percentage of the original cohort is still active:
Retention Rate
COUNTD([Customer Name]) / SUM([New Customers])Format: Percentage, 0 decimal places
Logic:
- Numerator:
COUNTD([Customer Name])- How many unique customers from this cohort made purchases in this period - Denominator:
SUM([New Customers])- How many customers were in this cohort originally - Result: % of original cohort still active
Important:
- This goes on Color shelf (creates heat map)
- Also place on Text shelf to display percentages
Step 5: Build the Cohort Table
5.1 Create Worksheet
- Create new worksheet
- Name it “Retention Rate” or “Cohort Analysis”
5.2 Add Dimensions to Rows
-
Drag [Acquisition Quarter] to Rows
- Make sure it’s discrete (blue pill)
- Change to exact date (right-click → select second option under date)
- Right-click → Sort → Descending (newest on bottom) or Ascending (oldest on top)
-
Drag [New Customers] to Rows (place after Acquisition Quarter)
- Make sure it’s discrete (blue pill)
- This displays cohort size next to each acquisition quarter
5.3 Add Dimension to Columns
- Drag [Quarters Since First Order] to Columns
- Ensure it’s discrete (blue pill)
- Right-click → Sort → Ascending (0, 1, 2, 3…)
- This creates the columns showing time progression
5.4 Add Metrics
- Drag [Retention Rate] to Color
- Creates heat map visualization
- High retention = darker blue
- Low retention = lighter blue
5.5 Format the View
-
Change Mark Type:
- Click Marks card → Change to Square
- Change Fit to Entire View
-
Color Scheme:
- Click Color → Choose Blue sequential palette
- Ensure darker = higher retention
- Click “Reversed” if needed
-
Text Labels:
- Click Label → Format as percentage
- Bold font, center alignment
- Adjust size (10-12pt works well)
-
Borders:
- Format → Borders
- Add light gray cell borders for clarity
Step 6: Final Formatting
-
Headers:
- Keep column headers (0, 1, 2, 3…) visible
- These indicate quarters since acquisition
-
Title:
- Add descriptive title: “Customer Retention by Quarter”
- Include subtitle explaining the metric
-
Tooltips (optional):
- Customize to show: Acquisition Quarter, Quarters Since First Order, Retention Rate, Number of Active Customers
Your cohort retention matrix is now complete!
- Click on Marks card
- Change from Automatic to Square
- Change Fit to Entire View
Step 8: Format the Visualization
8.1 Color Scheme
- Click Color on Marks card
- Choose a sequential palette:
- Blue (light to dark) - recommended
- Teal or Blue-Green work well
- Click “Reversed” if needed (darker = higher retention)
- Adjust stepped color if desired
8.2 Text Labels
- Click Label on Marks card
- Format: Percentage, 0 decimals
- Font: Bold, appropriate size (10-12pt)
- Alignment: Center
- Click “Show mark labels”
8.3 Remove Headers (Optional)
- For cleaner look, keep headers
- For presentation, you can customize axis titles
8.4 Borders
- Format → Borders
- Row Divider: Light gray
- Column Divider: Light gray
- Cell: White or light gray
8.5 Title
- Right-click title → Edit Title
- Example: “Customer Retention by Quarter”
- Add subtitle explaining the view
Step 9: Add Context and Labels
9.1 Column Headers
The quarters since acquisition (0, 1, 2, 3…) are self-explanatory.
Optionally add a text note:
- “0 = Acquisition quarter”
- “1 = One quarter later”
- etc.
9.2 Cohort Size Column
The “New Customers” column shows cohort size - this is crucial context:
- Larger cohorts may have different retention patterns
- Helps assess statistical significance
9.3 Dashboard Title
Add a clear title explaining the metric:
- “Customer Retention by Acquisition Cohort”
- “Quarterly Cohort Retention Analysis”
Step 10: Add Interactivity (Optional)
Enhance tooltips to show:
Acquisition Quarter: <Acquisition Quarter>
Quarters Since Acquisition: <Quarters Since Acquisition>
Retention Rate: <AGG(Retention Rate)>
Customers Active: <COUNTD(Customer ID)>
Original Cohort Size: <New Customers>
Advanced Variations
Monthly Cohorts
Change granularity for more detailed analysis:
// Acquisition Month
DATETRUNC('month', [First Purchase Date])

// Months Since Acquisition
DATEDIFF('month', [First Purchase Date], [Order Date])
Use case: More granular for businesses with short sales cycles
Revenue Retention
Track revenue instead of customer count:
// Revenue Retention Rate
SUM([Sales]) / {FIXED [Acquisition Quarter]: SUM([Sales])}Insight: Shows if retained customers are spending more or less over time
Cumulative Retention
Show cumulative percentages:
// Customers who have returned at least once by this quarter
COUNTD(IF [Quarters Since Acquisition] <= [Current Quarter]
       THEN [Customer ID] END)
/ [New Customers]
Churn Rate View
Flip the metric to show churn instead of retention:
// Churn Rate
1 - [Retention Rate]
Use case: Some stakeholders prefer to see churn directly
Business Applications
1. Product-Market Fit Validation
Question: “Do customers love our product enough to stick around?”
How: Look at long-term retention (quarters 8-12)
Good: >30% retention at quarter 12
Action: If low, investigate product value proposition
2. Customer Success Program ROI
Question: “Is our onboarding/CS program working?”
How: Compare cohorts before/after program launch
Example: 2022 Q1 vs 2021 Q1 retention curves
Action: Expand or modify program based on results
3. Pricing Strategy Validation
Question: “Did the price increase hurt retention?”
How: Compare retention of cohorts before/after price change
Watch for: Steeper drop-off in post-change cohorts
Action: Consider grandfathering or value adds
4. Marketing Channel Effectiveness
Question: “Which acquisition channels bring quality customers?”
How: Segment cohorts by acquisition channel
Compare: Paid ads vs organic vs referrals
Action: Invest more in channels with better retention
5. Seasonal Insights
Question: “Do Q4 holiday customers stick around?”
How: Compare Q4 cohort retention to other quarters
Finding: Often lower (gift buyers, deal seekers)
Action: Targeted re-engagement campaigns
Acknowledgments
- Built using Tableau’s Sample - EU Superstore dataset
- Cohort analysis methodology based on industry best practices
- Inspired by retention analysis frameworks from leading SaaS companies