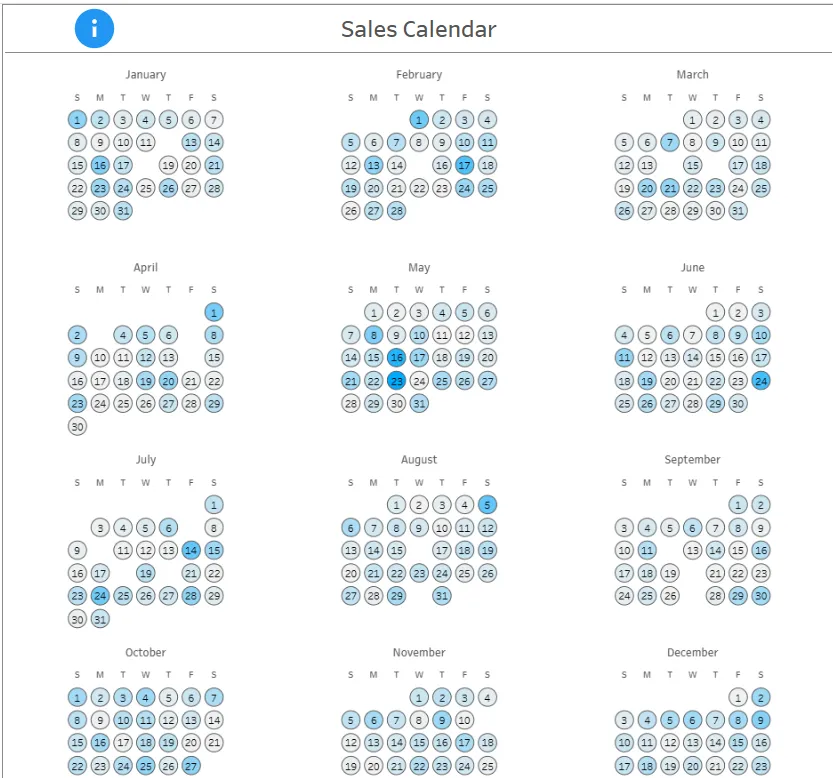
Sales Calendar
Dashboard-calendar to track daily sales performance.

Dashboard Preview
Business Value
Why a Sales Calendar?
Traditional line charts and bar graphs can make it difficult to spot day-of-week patterns or specific date anomalies. A calendar view provides:
- Instant Pattern Recognition: Quickly identify which days of the week consistently perform well or poorly
- Seasonal Insights: Spot trends across weeks and months at a glance
- Anomaly Detection: Easily identify unusual spikes or drops on specific dates
- Executive Communication: Intuitive format that stakeholders immediately understand
- Planning Support: Align marketing campaigns, promotions, and resource allocation with historical patterns
Use Cases
- Retail: Identify peak shopping days and plan inventory accordingly
- Sales Teams: Set realistic daily targets based on historical performance
- Marketing: Schedule campaigns around high-performance days
- Operations: Plan staffing levels based on expected sales volume
- Finance: Forecast revenue with day-level granularity
Key Features
- Full Year View: All 12 months displayed simultaneously
- Color-Coded Performance: Sales values represented by color intensity
- Hover Details: Tooltip shows exact sales value and monthly trend
- Interactive Filtering: Filter by year to compare different periods
- Weekday Labels: Clear S-M-T-W-T-F-S headers for each month
- Trend Analysis: Hover over month name to see sales trend line
How It Works
This calendar is built using Tableau’s spatial functions (MAKEPOINT) to position each date as a circle in a grid layout. The technique involves:
- Creating a coordinate system using week numbers and weekdays
- Positioning each date as a point in 2D space
- Organizing into quarters to display 3 months per row
- Color-coding by sales value for visual analysis
- Adding interactive tooltips with trend sparklines
Technical Highlights
- Uses
MAKEPOINT()function to create spatial coordinates - Custom calculated fields for week offset and weekday positioning
- Fixed-level-of-detail (LOD) calculations for first week per month
- Multiple mark layers for dates, weekday labels, and month labels
- Integrated trend visualization in tooltips
📖 Step-by-Step Build Guide
Prerequisites
-
Tableau Desktop or Tableau Public
-
Dataset with: Date field and Sales/Revenue metric
-
Sample data structure:
Date        | Sales
------------|--------
2017-01-01  | 2500
2017-01-02  | 3200
...         | ...
Data Preparation
Before starting, ensure your data has:
- A Date field (any date format)
- A Sales or revenue metric (numeric)
- Ideally one year or more of daily data
Step 1: Create Base Date Calculations
1.1 Month Name
DATENAME('month', [Date])1.2 Month Grouping
- Put
Month Nameon Rows - Select January, April, July, October together
- Right-click → Create Group (clip icon)
- Right-click new group → Edit Alias → Name it “1”
- Repeat for other month groups:
- Group 2: February, May, August, November
- Group 3: March, June, September, December
1.3 Quarter Date
- Put
Month Name (group)on Columns - Put
Dateon Rows → Select discrete Quarter
1.4 Weekday
- Put
Dateon Columns → Select WEEKDAY (discrete)
Step 2: Create Week Positioning Calculations
2.1 First Week per Month (LOD Calculation)
{FIXED DATETRUNC('month', [Date]): MIN(DATEPART('week', [Date]))}- Move this calculation to Dimensions
- Drag to Rows
2.2 Week Offset
-(DATEPART('week', [Date]) - [First Week per Month])Note: Negative sign flips the calendar right-side up
- Move to Dimensions
- Drag to Rows
2.3 Clean Up Rows
- Remove
WEEK(Date)from Rows - Remove
First Week per Monthfrom Rows
Step 3: Create Weekday Positioning
3.1 Weekday
DATEPART('weekday', [Date])For non-US locales (if Monday is first day of week):
IF DATEPART('weekday', [Date]) = 1
THEN 7
ELSE DATEPART('weekday', [Date]) - 1
END- Move to Dimensions
- Drag to Columns
Step 4: Build the Calendar Grid
4.1 Create Main Calendar Sheet
- Create new worksheet
- Add
YEAR(Date)to Filters → Select desired year
4.2 Day Point Calculation
MAKEPOINT([Week Offset], [Weekday #])This treats Week Offset as latitude and Weekday # as longitude
4.3 Arrange Layout
- Double-click
Day Pointcalculation - Put
Month Name (group)on Columns - Put discrete
QUARTER(Date)on Rows
Step 5: Add Date Labels
- Put
Dateon Label → Select discrete DAY - Change mark type to Circle
- Increase circle size using Size shelf
Step 6: Add Color by Sales
- Drag
Salesto Color - Click Color → Remove Halo
- Click Color → Add dark Border to circles
Step 7: Format Labels
- Click Label → Align text to center
- Adjust font size as needed
Step 8: Add Weekday Labels
8.1 Create Weekday Label Calculation
MAKEPOINT(1, [Weekday #])- Drag to Marks card (creates new layer)
8.2 Configure Weekday Layer
- Change mark type to Text
- Put
Dateon Text → Select WEEKDAY (discrete) - Right-click
WEEKDAY(Date)→ Format → Pane → First Letter only - Remove Halo background
Step 9: Add Month Labels
9.1 Create Month Label Calculation
MAKEPOINT(2, 4)2 = above weekday labels, 4 = centered
- Drag to Marks card (creates new layer)
9.2 Configure Month Layer
- Change mark type to Text
- Put
Month Nameon Text - Remove Halo background
Step 10: Add Trend Tooltip
10.1 Create Trend Sheet
- Create new worksheet
- Put continuous
Dateon Columns - Put
Saleson Rows
10.2 Link to Calendar
- Go back to Calendar sheet
- Add
Salesto Detail - Add
Date(Month/Year option) to Detail
10.3 Configure Tooltips
For Month Label layer:
Month: <Month Name>
Total Sales: <SUM(Sales)>

Hover to see trend
[Insert Sheet: Trend Sheet]
For Day Point layer:
Date: <DAY(Date)> <DATENAME('month', Date)>
Sales: <Sales>

Monthly trend:
[Insert Sheet: Trend Sheet]
Step 11: Final Formatting
11.1 Hide Headers
- Right-click
Month Name (group)on Columns → Uncheck “Show Header” - Right-click
QUARTER(Date)on Rows → Uncheck “Show Header”
11.2 Remove Borders
- Format → Borders
- Row Divider: None
- Column Divider: None
11.3 Clean Map Background
- Map → Map Layers
- Adjust opacity or disable background map
- Washout map elements
Customization Ideas
- Change Color Scheme: Use diverging colors for above/below target
- Add Target Lines: Show daily target values
- Multiple Metrics: Create separate calendars for units sold, profit, etc.
- Comparative View: Side-by-side calendars for year-over-year comparison
- Annotations: Add notes for promotions, events, or anomalies
Tips & Tricks
Common Issues
Issue: Calendar is upside down
Solution: Add negative sign to Week Offset calculation
Issue: Week starts on wrong day
Solution: Adjust Weekday # calculation for your locale
Issue: Months not aligned
Solution: Check Month Name grouping - should be 3 groups of 4 months
Issue: Circles overlapping
Solution: Ensure Week Offset and Weekday # are in Dimensions, not Measures
Acknowledgments
- Inspiration from various Tableau calendar visualizations in the community
- Technique adapted from Tableau spatial analysis methods