Sales Performance Dashboard
Sales performance across bsiness units, products, and sectors.

Dashboard Previews
Overview Dashboard
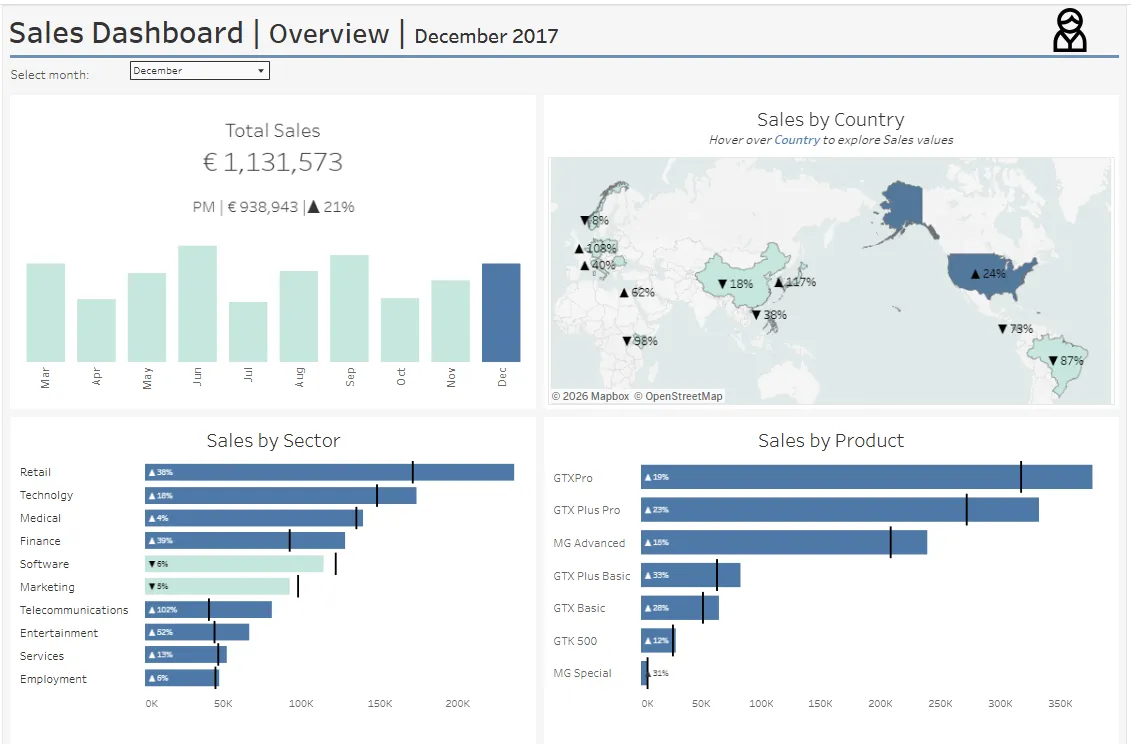
Organization-wide sales performance with geographic distribution, sector analysis, and product breakdown
Manager Performance Dashboard
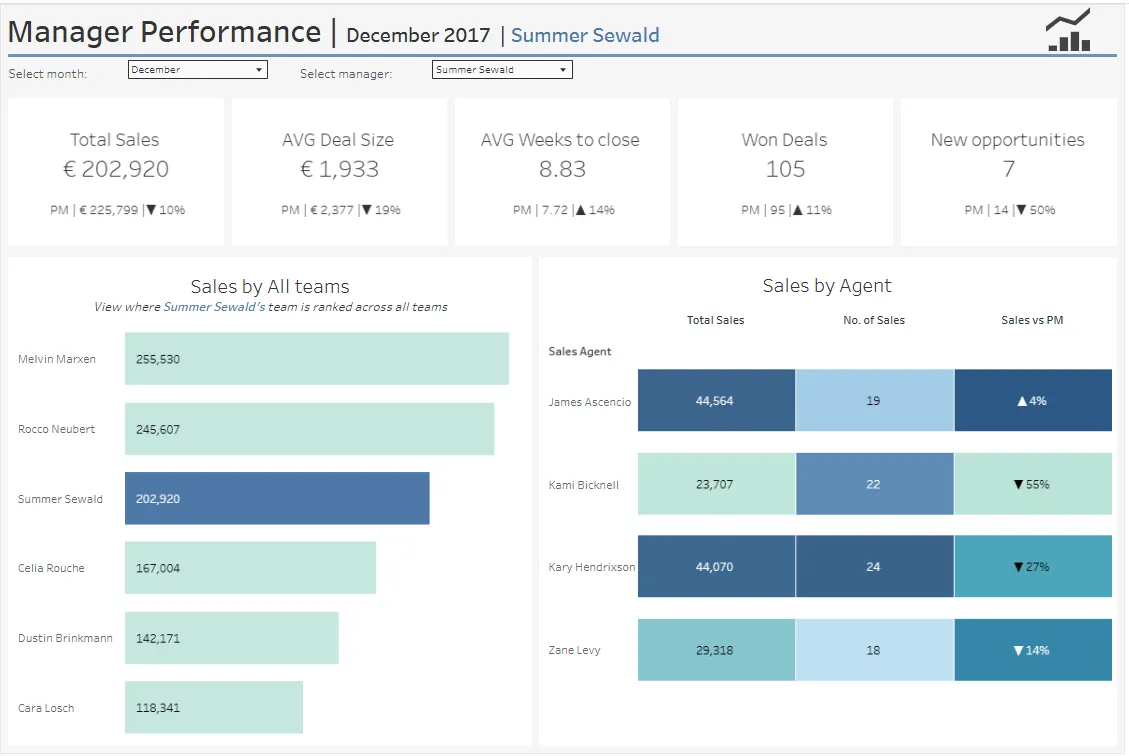
Detailed team and individual performance metrics with comparative rankings
Business Value
What This Dashboard Solves
Sales organizations struggle with fragmented data across teams, products, and time periods. This dashboard provides:
- Executive Visibility: High-level organizational performance at a glance
- Manager Accountability: Track team performance with month-over-month trends
- Performance Insights: Identify top performers and areas needing attention
- Strategic Planning: Analyze performance by product, sector, and geography
- Sales Cycle Optimization: Monitor average time to close deals
- Pipeline Health: Track new opportunity generation
Critical Business Questions Answered
-
“How are we performing vs last month?”
Automatic month-over-month comparisons with trend indicators -
“Which managers/teams are hitting targets?”
Comparative rankings across all managers -
“What products/sectors drive revenue?”
Revenue breakdown by product line and industry sector -
“Where should we focus geographically?”
Sales distribution map highlighting top-performing regions -
“How efficient is our sales process?”
Average deal size and weeks-to-close metrics -
“Is our pipeline healthy?”
New opportunities generation tracking
Key Features
Two Integrated Dashboards
1. Overview Dashboard
- Total sales KPI with trend indicator
- Monthly sales trend (March - December 2017)
- Geographic sales map with country-level performance
- Sales by sector
- Sales by product
2. Manager Performance Dashboard
- Five KPI cards: Total Sales, Avg Deal Size, Avg Weeks to Close, Won Deals, New Opportunities
- All with month-over-month comparisons and trend arrows
- Manager ranking comparison (sales by all teams)
- Individual agent performance breakdown
- Interactive filtering by manager and month
Interactive Parameters
- Select Manager: Choose from 6 sales managers
- Select Month: Filter by month (March - December)
- Filters apply across all visualizations
Dashboard Components
KPI Metrics Explained
Total Sales
Sum of all closed/won deals for selected manager and month
- Shows actual revenue generated
- Compares to previous month
- Trend indicator (▲ growth / ▼ decline)
Average Deal Size
Mean value of won deals
- Indicates deal quality and pricing power
- Higher values suggest larger contracts or premium products
- Track changes in deal mix over time
Average Weeks to Close
Mean time from engagement to deal closure
- Measures sales cycle efficiency
- Lower is better (faster deals)
- Identifies bottlenecks in sales process
Won Deals
Count of successfully closed opportunities
- Volume metric showing sales productivity
- High count + low deal size = many small wins
- Low count + high deal size = fewer large deals
New Opportunities
Count of new engagements in selected month
- Leading indicator for future sales
- Measures pipeline generation
- Critical for forecasting
Visualizations
Geographic Map
- Filled map showing sales by country
- Color intensity = performance level
- Percentage indicators show growth/decline
- Hover for detailed country metrics
Sales by Sector
- Horizontal bar chart
- Ranked from highest to lowest revenue
- Current month Revenue represented as Bar, previous month - as gantt bar
- Color intensity: If the current month’s performance is lower than the previous month’s, the bar is displayed in a lighter shade compared to months with stronger performance.
Sales by Product
- Horizontal bar chart
- Identifies best-selling products
- Current month Revenue represented as Bar, previous month - as gantt bar
- Color intensity: If the current month’s performance is lower than the previous month’s, the bar is displayed in a lighter shade compared to months with stronger performance.
Sales by All Teams
- Comparative manager ranking
- Selected manager highlighted
- Total sales for each team
- Context for individual performance
Sales by Agent
- Three-column view: Total Sales, Number of Sales, Trend vs Previous Month
- Color-coded performance indicators
- Shows individual contributor metrics
- Only displays agents for selected manager
Technical Implementation
Data Architecture
Four Connected Data Sources:
- sales_pipeline.csv: Opportunity details, deal stages, dates, values (~8,800 records)
- sales_teams.csv: Agent-manager relationships, regional offices (~35 agents)
- accounts.csv: Customer company information, sectors, revenue (~85 accounts)
- products.csv: Product catalog, pricing, series (7 products)
Data Model:
- Federated connection with relationships
- Optimized with Tableau extract (327KB)
- Year filtered to 2017
Key Calculated Fields
Month-over-Month Sales for Sales Dashboard
// Current Month Sales
IFNULL(
  SUM(
    IF MONTH([close_date]) = [Select Month]
       AND [deal_stage] = 'Won'
    THEN [close_value]
    END
  ), 0
)

// Previous Month Sales
IFNULL(
  SUM(
    IF MONTH([close_date]) = [Select Month] - 1
       AND [deal_stage] = 'Won'
    THEN [close_value]
    END
  ), 0
)

// Percentage Change
IF [Sales Value PM] = 0 THEN
  IF [Sales Value] = 0 OR ISNULL([Sales Value]) THEN 0
  ELSE 1
  END
ELSE
  ([Sales Value] - [Sales Value PM]) / [Sales Value PM]
END
Month-over-Month Sales for Managers Performance Dashboard
// Current Month Sales
IFNULL(
  SUM(
    IF MONTH([close_date]) = [Select Month]
       AND [Manager]=[Select manager]
       AND [deal_stage] = 'Won'
    THEN [close_value]
    END
  ), 0
)

// Previous Month Sales
IFNULL(
  SUM(
    IF MONTH([close_date]) = [Select Month] - 1
       AND [Manager]=[Select manager]
       AND [deal_stage] = 'Won'
    THEN [close_value]
    END
  ), 0
)

#### Average Deal Size
```tableau
IFNULL(
  AVG(
    IF MONTH([close_date]) = [Select Month]
       AND [manager] = [Select Manager]
       AND [deal_stage] = 'Won'
    THEN [close_value]
    END
  ), 0
)
Average Weeks to Close
IFNULL(
  AVG(
    IF MONTH([close_date]) = [Select Month]
       AND [manager] = [Select Manager]
       AND [deal_stage] = 'Won'
    THEN DATEDIFF('week', [engage_date], [close_date])
    END
  ), 0
)
Won Count
IFNULL(
  COUNT(
    IF MONTH([close_date]) = [Select Month]
       AND [manager] = [Select Manager]
       AND [deal_stage] = 'Won'
    THEN [opportunity_id]
    END
  ), 0
)
New Opportunities
COUNT(
  IF [deal_stage] = 'Engaging'
     AND [manager] = [Select Manager]
     AND MONTH([engage_date]) = [Select Month]
     AND YEAR([engage_date]) = 2017
  THEN [opportunity_id]
  END
)
Technical Highlights
- Null-safe calculations: All metrics handle missing data gracefully
- Dynamic filtering: Parameters enable real-time filtering without refreshing
- Conditional logic: Complex IF statements for month-over-month comparisons
- LOD calculations: Fixed-level-of-detail for aggregate metrics
- Date intelligence: DATEPART, DATEDIFF, DATETRUNC functions
- Color-coded indicators: Automatic up/down arrows based on performance
Use Cases by Role
Executives
- Monitor overall sales health
- Identify top-performing sectors and products
- Track geographic expansion opportunities
- Make strategic resource allocation decisions
Sales Managers
- Review team performance vs peers
- Track individual agent productivity
- Identify coaching opportunities
- Monitor pipeline health
Sales Operations
- Analyze sales cycle efficiency
- Identify process bottlenecks
- Forecast based on trends
- Optimize territory assignments
Product Teams
- Understand product performance
- Identify best-selling products
- Plan inventory and development priorities
Data Dictionary
Sales Pipeline Fields
opportunity_id: Unique deal identifiersales_agent: Sales representative nameproduct: Product soldaccount: Customer accountdeal_stage: Engaging, Prospecting, Won, Lostengage_date: Initial engagement dateclose_date: Deal closure dateclose_value: Deal value in euros
Sales Teams Fields
sales_agent: Sales representative namemanager: Team manager nameregional_office: Office location
Accounts Fields
account: Company namesector: Industry sectoryear_established: Company founding yearrevenue: Annual revenueemployees: Employee countoffice_location: Company headquarters
Products Fields
product: Product nameseries: Product linesales_price: Standard price
Acknowledgments
- Data source: Maven Analytics CRM Sales Opportunities dataset
- Built with Tableau Desktop 2025.1
- Inspired by enterprise sales analytics best practices